Endogenous Production Networks
Project description
Production networks live at the heart of modern economies and global value chains. Shocks such as demand shifts, technological change, and the emergence (death) of new (old) industries generate responses that propagate across their linkages. Most analytic tools analyse some of these shocks by considering production networks to be exogenous, while others that try to explain their formation have limited real-world applicability.
This project is developing models of how such networks emerge from the learning process of firms under uncertainty; without having perfect knowledge of the nature of technology (also known as production functions). These models can be calibrated with publicly available input-output datasets and deployed with various types of production functions, facilitating the analysis of structural transformations such as drastic technological changes. The tools produced by this project can be used to support evidence-based policymaking, for example, when formulating national industrial strategies or when considering supporting emergent industries.
Demonstration
Industries learn and adapt with limited information
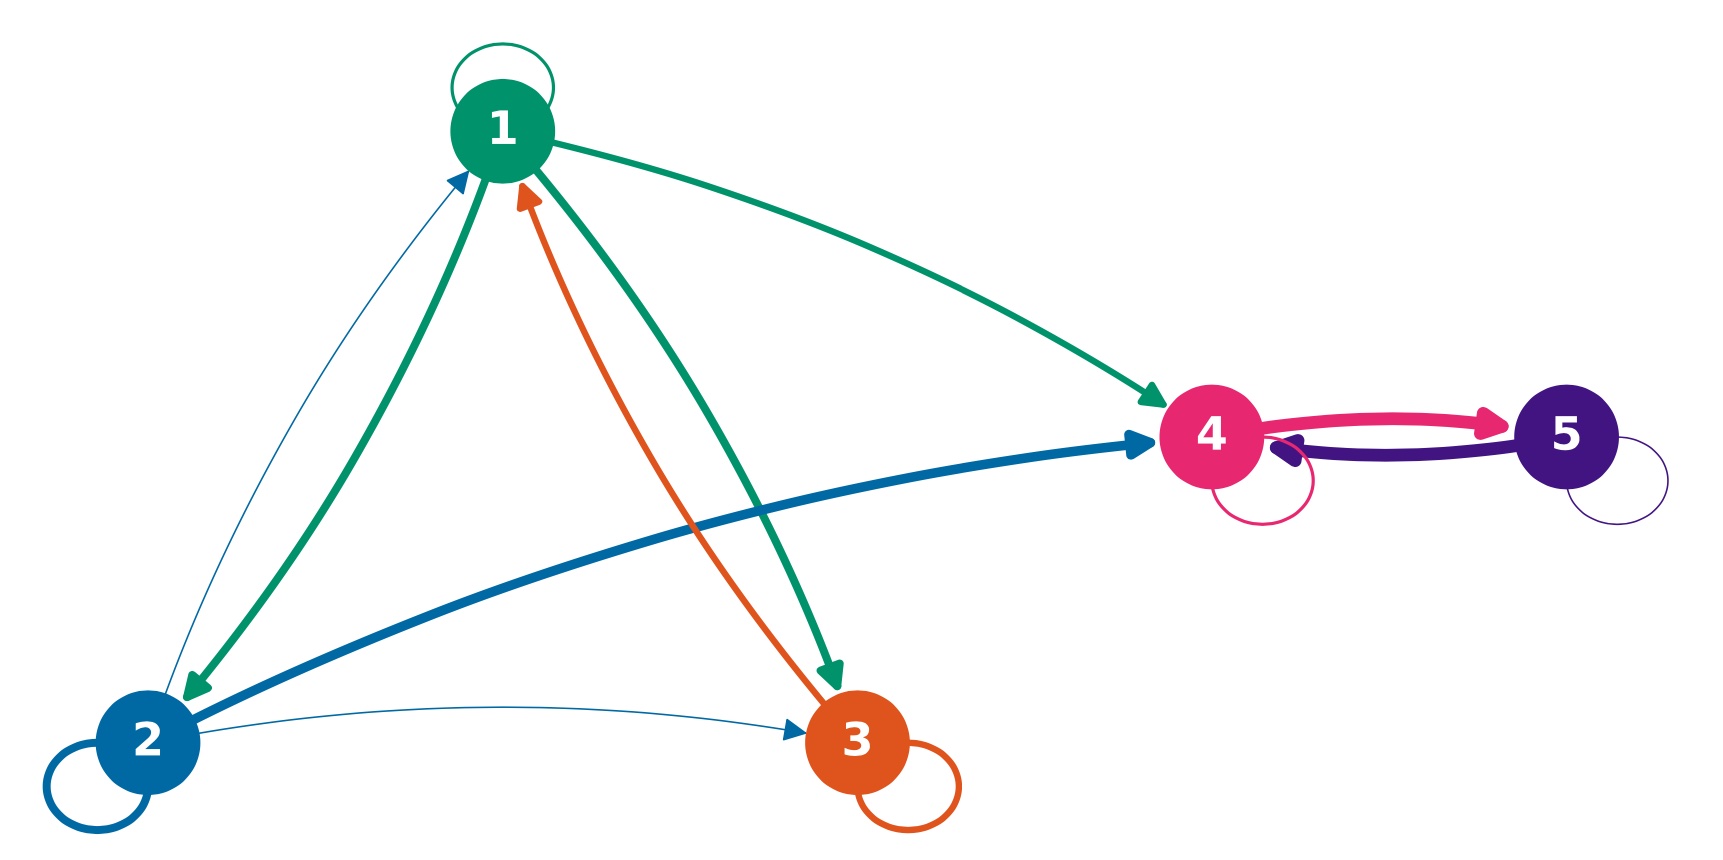
This is a simple economy with five industries. These industries acquire knowledge about prices and quantities solely through observing the impact of their decisions on profits. Notably, we depart from conventional models by discarding assumptions related to technology (production functions) and demand curves.
Resilience to shocks
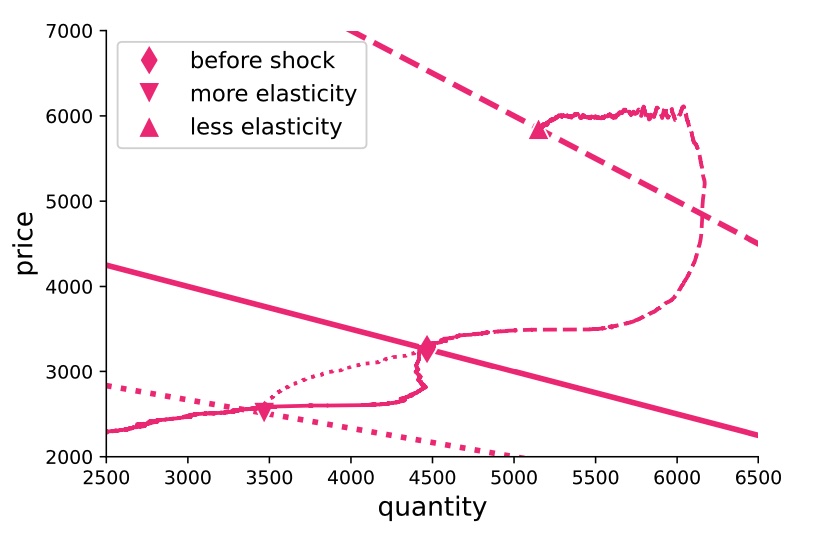
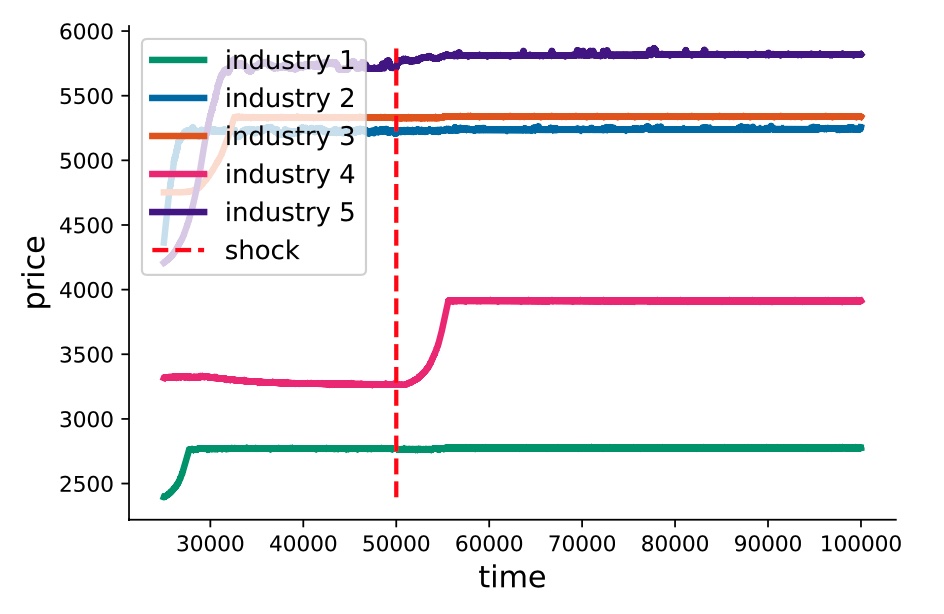
Following are examples of the simple five-industry economy responding to shocks.
Demand shock
Technological change
Experiment with empirically calibrated model
A simple experiment uncovered the intricate relationship between industry productivity and its impact on the broader economy. By calibrating our model to OECD input-output datasets within the UK context, specifically considering 44 industries, then increasing 10% productivity in an industry, we observe very far-reaching effects on the whole economy. The experiment underscores the need for nuanced analysis and sophisticated modeling techniques.
Please choose an industry in the dropbox below to see how 10% productivity increase for one industry affect the broader economy. The industries in the dropdown box are sorted by sum of inflows (from most to least). There are 4 bar chart for total inflows, price, volume, and profit. Each bar charts shows the net change across 44 industries. The industry with increased activities has a larger width then the rest.
People
Publications
- Vu, T. M., Guerrero, O. A. (2022). Endogenous Production Networks Emerging from Myopic Firms. In 2022 International Conference on Computational Social Science (IC2S2).
Resources
Online repository (upcoming)